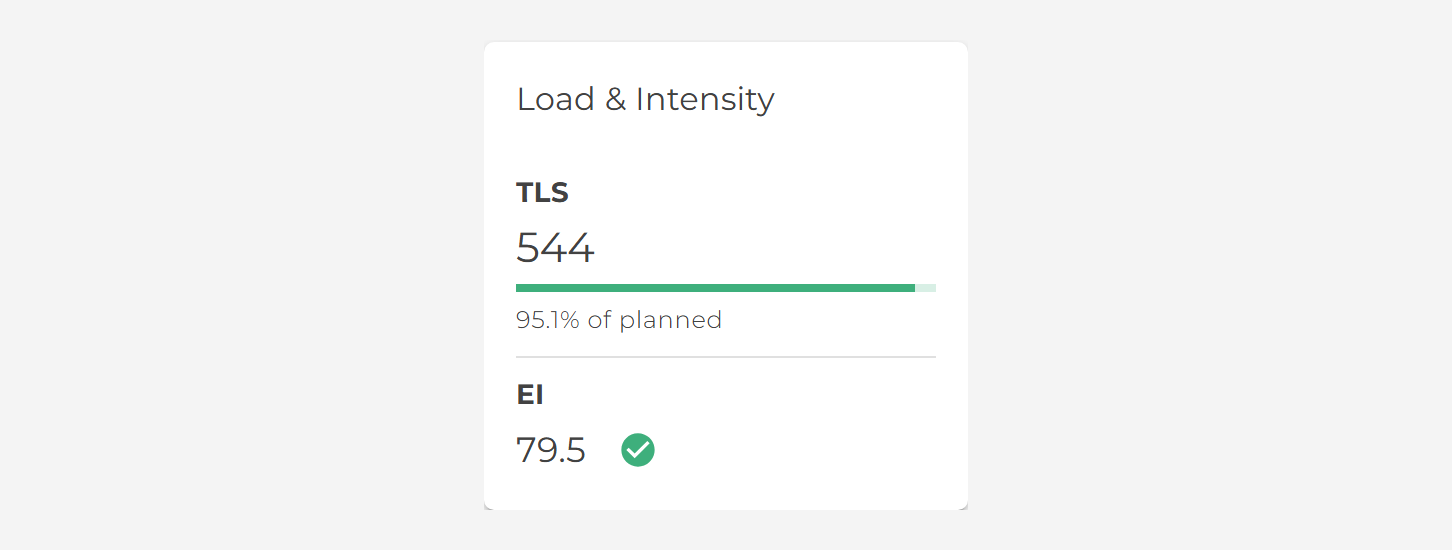
Every finished workout that was assigned with a plan gets a training load score (TLS) and a planned TLS. Smagpie compares the two and colours the result:
- Green (shown as On Plan): the load was within your team’s green tolerance of the plan. 10% by default.
- Yellow: off plan, but within the yellow tolerance. 20% by default.
- Red: further off than that.
Over and under count the same. With the defaults, a session at 115% of plan is yellow, and so is one at 85%. When a session is off plan, the label shows by how much, for example +15%. The figure is rounded away from plan, so a session that just crossed a tolerance never reads a number inside it: 10.3% over reads +11%.
Runs, rides, swims and other timed sessions use the endurance tolerances. Strength sessions, and yoga and pilates, use the strength tolerances.
For runs, rides and swims, the EI (effort intensity) pill compares how hard the session was against how hard you wrote it.
- Green (On Plan): within your team’s Intensity tolerance, 10% above or below plan by default. One training zone is roughly 10%, so the default flags a session run about a zone too hard or too easy.
- Red: beyond it, with the % it was off.
Intensity has no yellow band. It is the same rule the Coach Hub uses for its intensity arrow, so the pill and the Hub always agree.
The same score, with the same colours, shows up in each of these places:
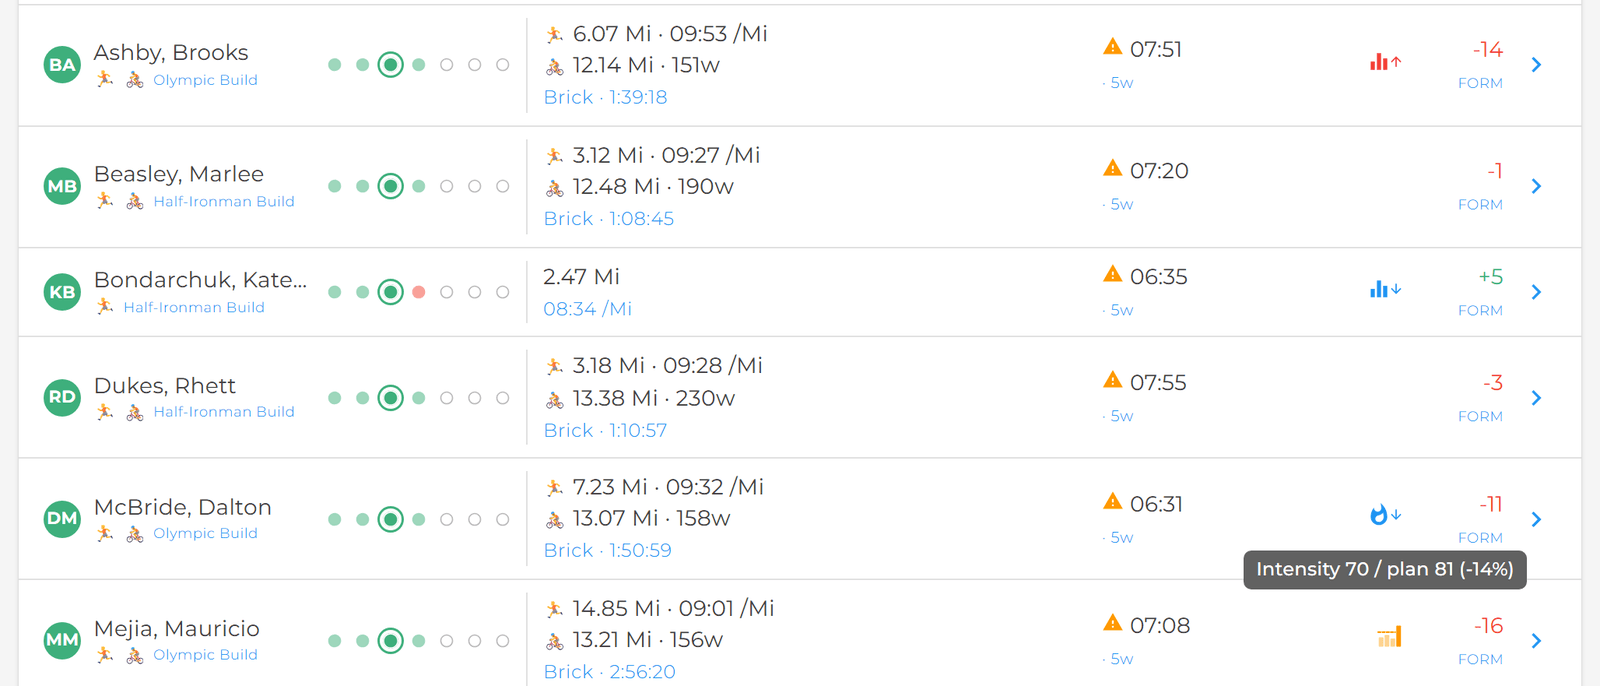
- Coach Hub: an arrow next to an athlete’s Form when their assigned run, ride or swim went well off plan on load or intensity. See Why is there an arrow next to an athlete’s Form on the Coach Hub?
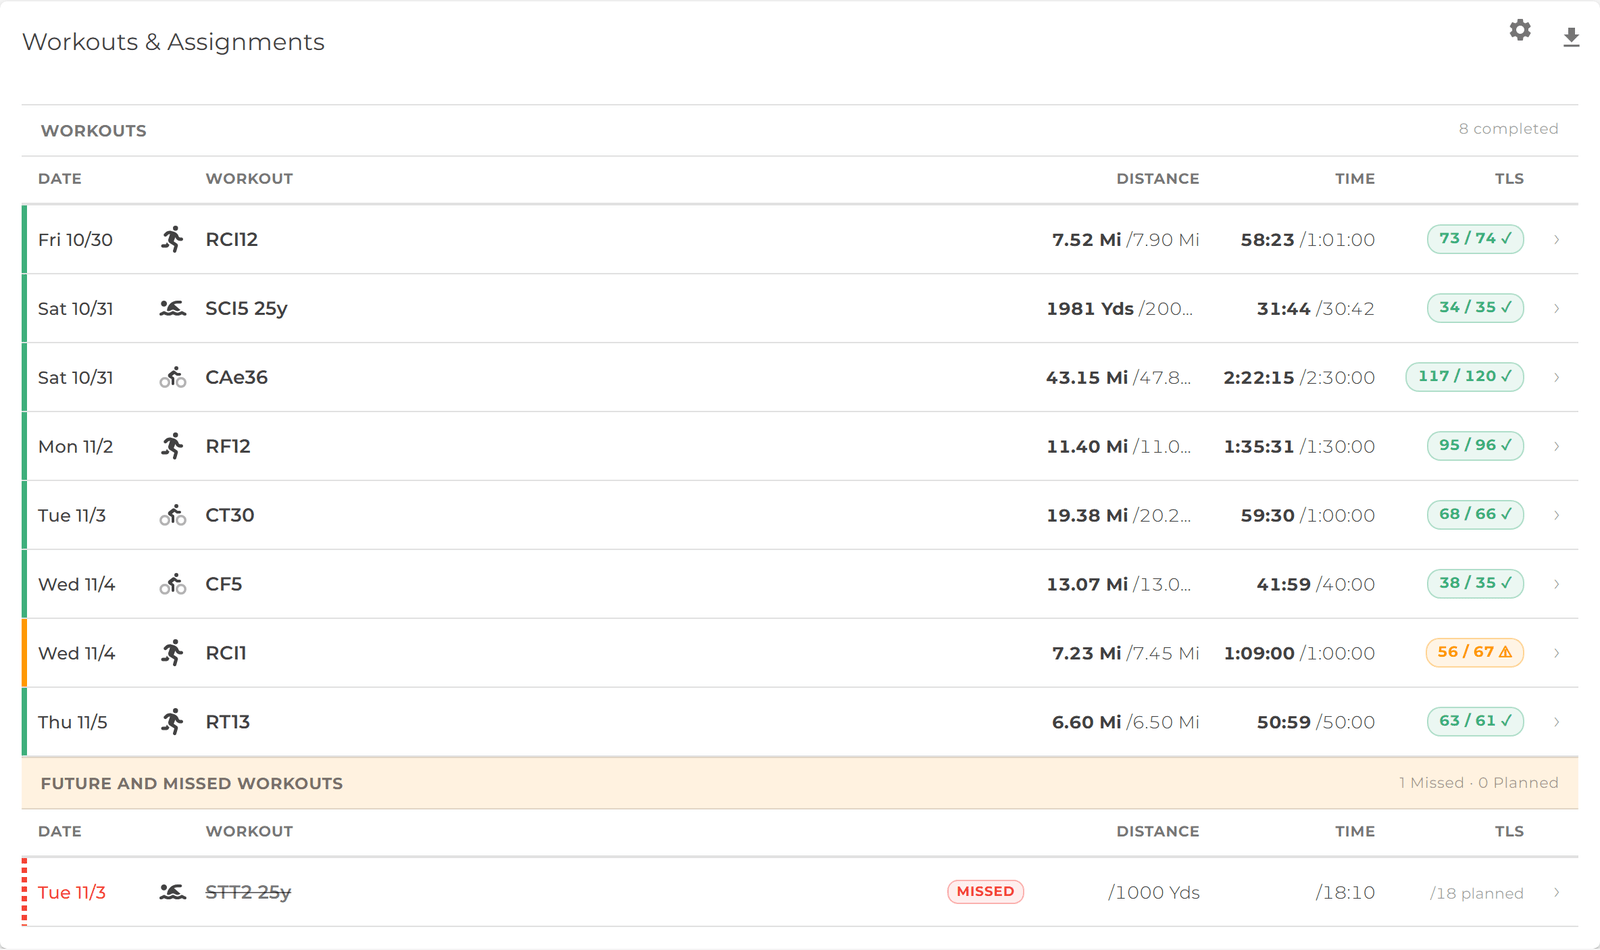
- The workout log: each row has a coloured band and a pill with the % off plan.
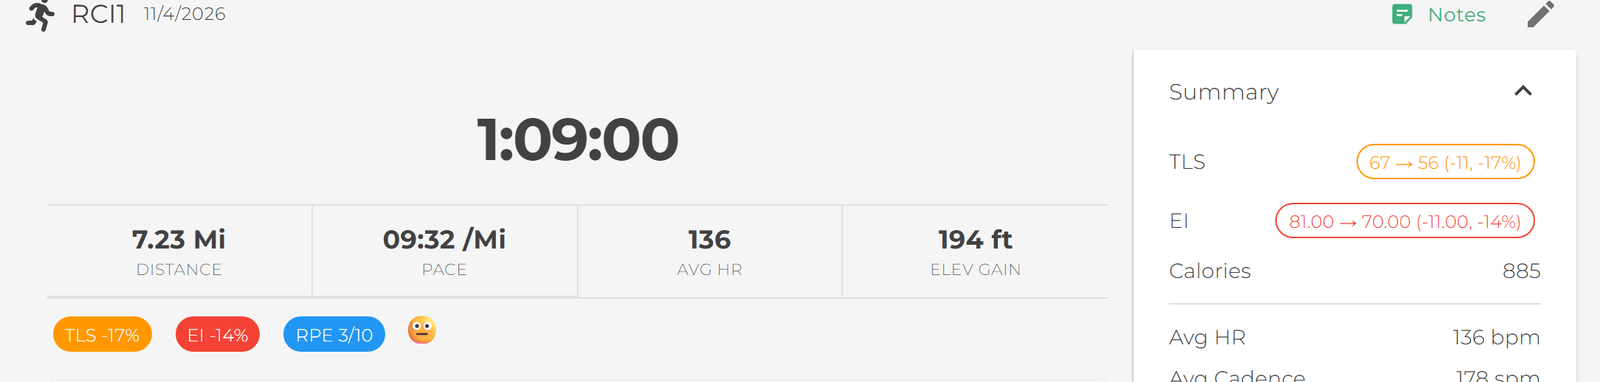
- The workout detail: the TLS and EI pills at the top, and the matching chips in the Summary.
- The strength detail: the TLS figure, pill and Summary chip.
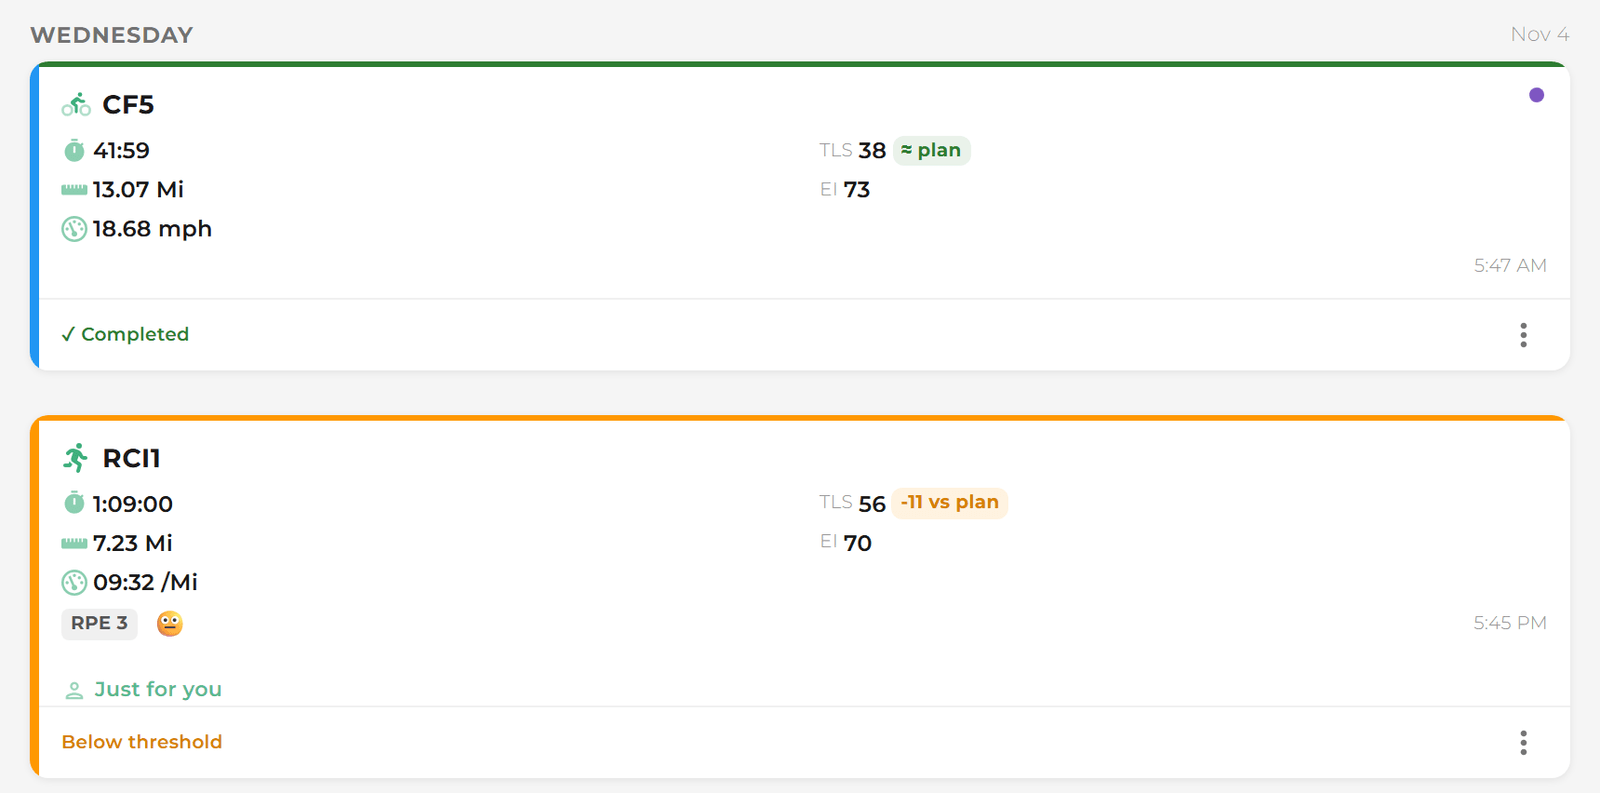
- The athlete’s schedule: on Today, the week and the month views, a finished workout’s card has a coloured strip. Green reads ≈ plan; yellow and red show the difference, for example +15 vs plan, and say Above threshold or Below threshold.
- The athlete dashboard: a check beside the average EI when the athlete’s sessions were on plan for intensity, a warning when they weren’t.
Athletes see the same colours on their own workouts as their coach does.
Open Team Settings → Compliance:
- Endurance Compliance: Green tolerance (%) and Yellow tolerance (%) for runs, rides, swims and other timed sessions. Defaults 10 and 20.
- Intensity tolerance (%): one number for EI, above or below plan. Default 10.
- Strength Compliance: Green tolerance (%) and Yellow tolerance (%) for strength sessions. Defaults 10 and 20.
Click Save Compliance Settings. Every surface listed above uses the new numbers, for you and your athletes. A workout, schedule or dashboard that’s already open re-colours without a reload.
The same card holds the volume-jump limits. See How do I change the volume jump limit?
A grey pill, band or card strip means there’s nothing to score against:
- No plan. The session was ad-hoc, or the assignment had no planned load. The card still says ✓ Completed.
- No data. The watch file didn’t give Smagpie enough to compute a load or intensity, so it’s stored as 0. The pill shows that 0 in grey; it never reads as -100% or red.
Grey never counts as off plan.
The strength detail shows two different things:
- TLS is session compliance: the training load done against the load planned, coloured by your team’s strength tolerances.
- Sets is completion: the sets done against the sets prescribed. It has fixed bands that don’t follow the Compliance settings: all sets done is green, 80% or more is yellow, less is red. The Met, Partial and Missed icons on each set use the same rule.
So an athlete who did every set at a lighter weight can have a green Sets figure and a yellow TLS.