Prefer to watch? A coach reads one athlete’s week, a run and a ride, the way she would in a review: the pills, the boxes, the zones, the athlete’s own feel, and whether the engine is getting better.
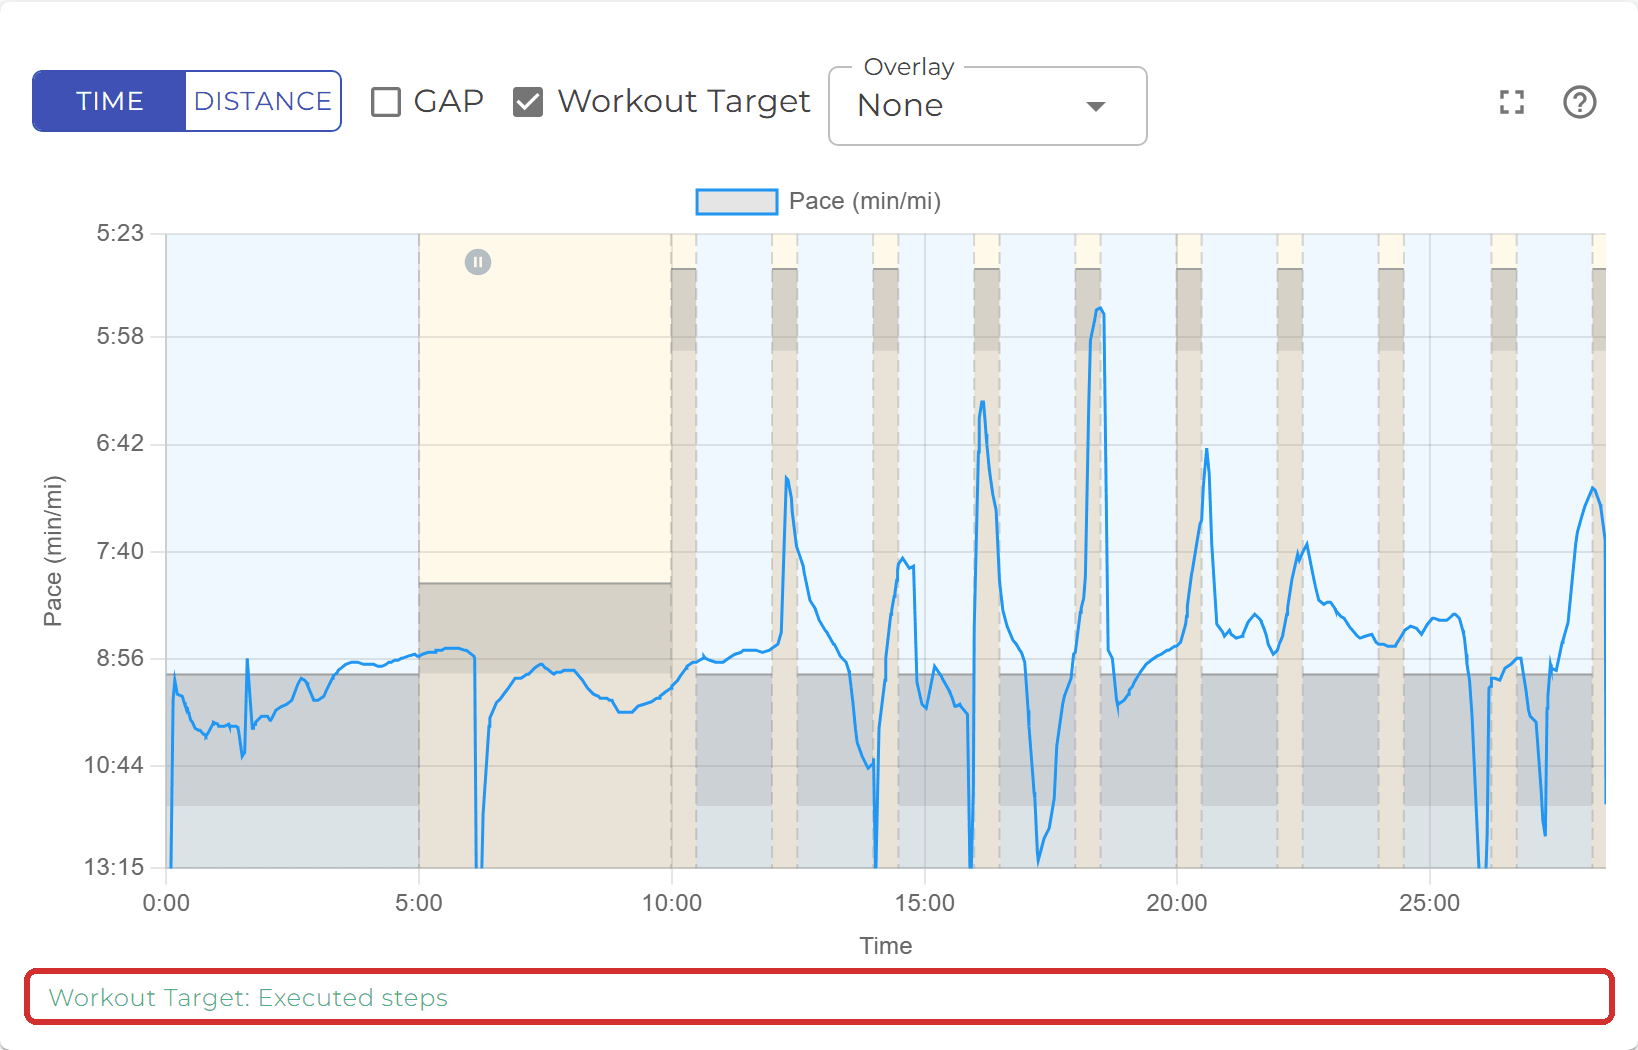
Open a finished workout from the schedule, your dashboard or a notification and, when the watch recorded it, the detail page carries a chart. The blue line is the athlete’s pace for a run (power for a bike, see How does the chart differ for a bike workout?), read from the watch file.
The ? icon at the very end of the control row opens this page.

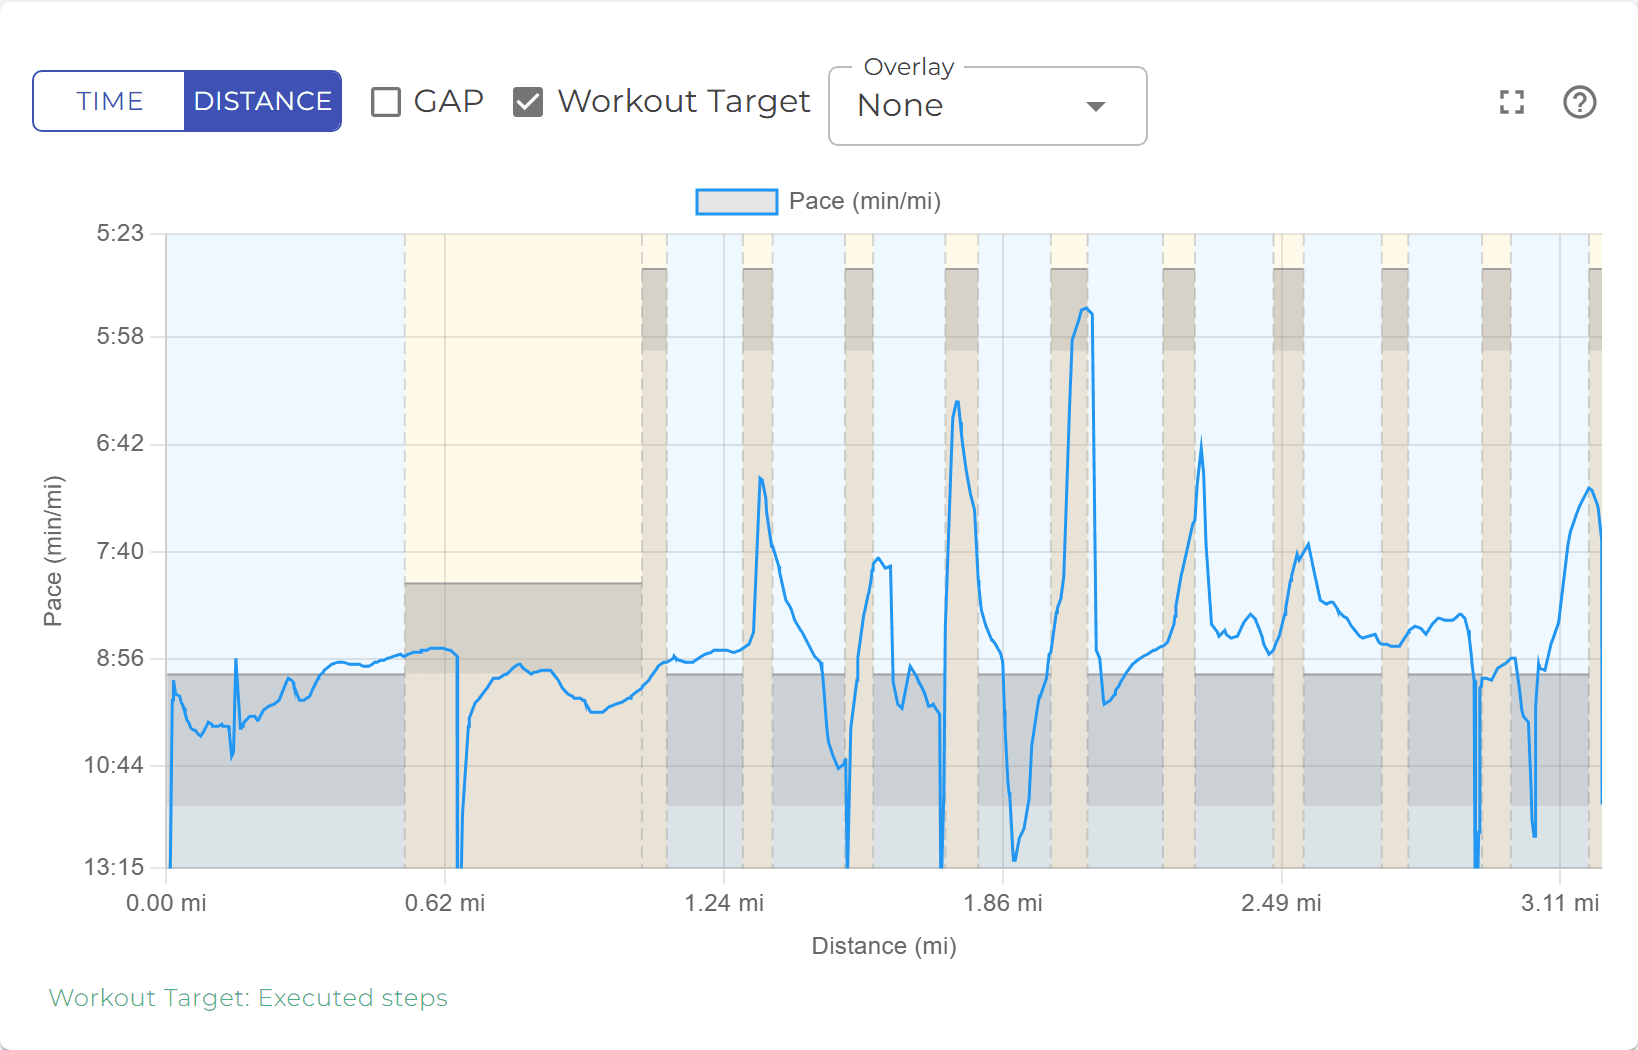
- Time or Distance along the bottom. Time is the default (moving time, so watch pauses take no width); Distance stretches the same workout over the miles or kilometres run. The axis ends where the data ends, not at the next round number.
- The legend above the plot names the series, and any overlay you add joins it.
- The scale on the left fits the real effort. A GPS spike or a few seconds at a standstill do not stretch the axis, so the intervals stay readable; the targets are always kept in view.
When the workout was assigned with targets, every step with a pace or power target draws two grey shapes:
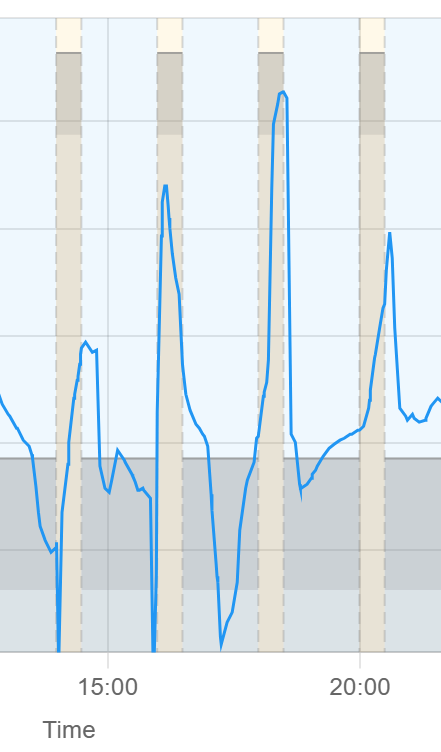
- The box spans the target range for that step (a thin band when the target is a single value). The line sitting inside the box means the step was run on target.
- The skyline fills the plot from the bottom up to the slow edge of the target. Where the line is above the skyline, the athlete was faster than the target asked for; inside it, slower.
- The tint behind each step is its intensity: warm-up, cool-down and recovery steps are blue, active and interval steps amber, rest steps have none. Dashed dividers mark where one step ended and the next began.
Hiding the targets
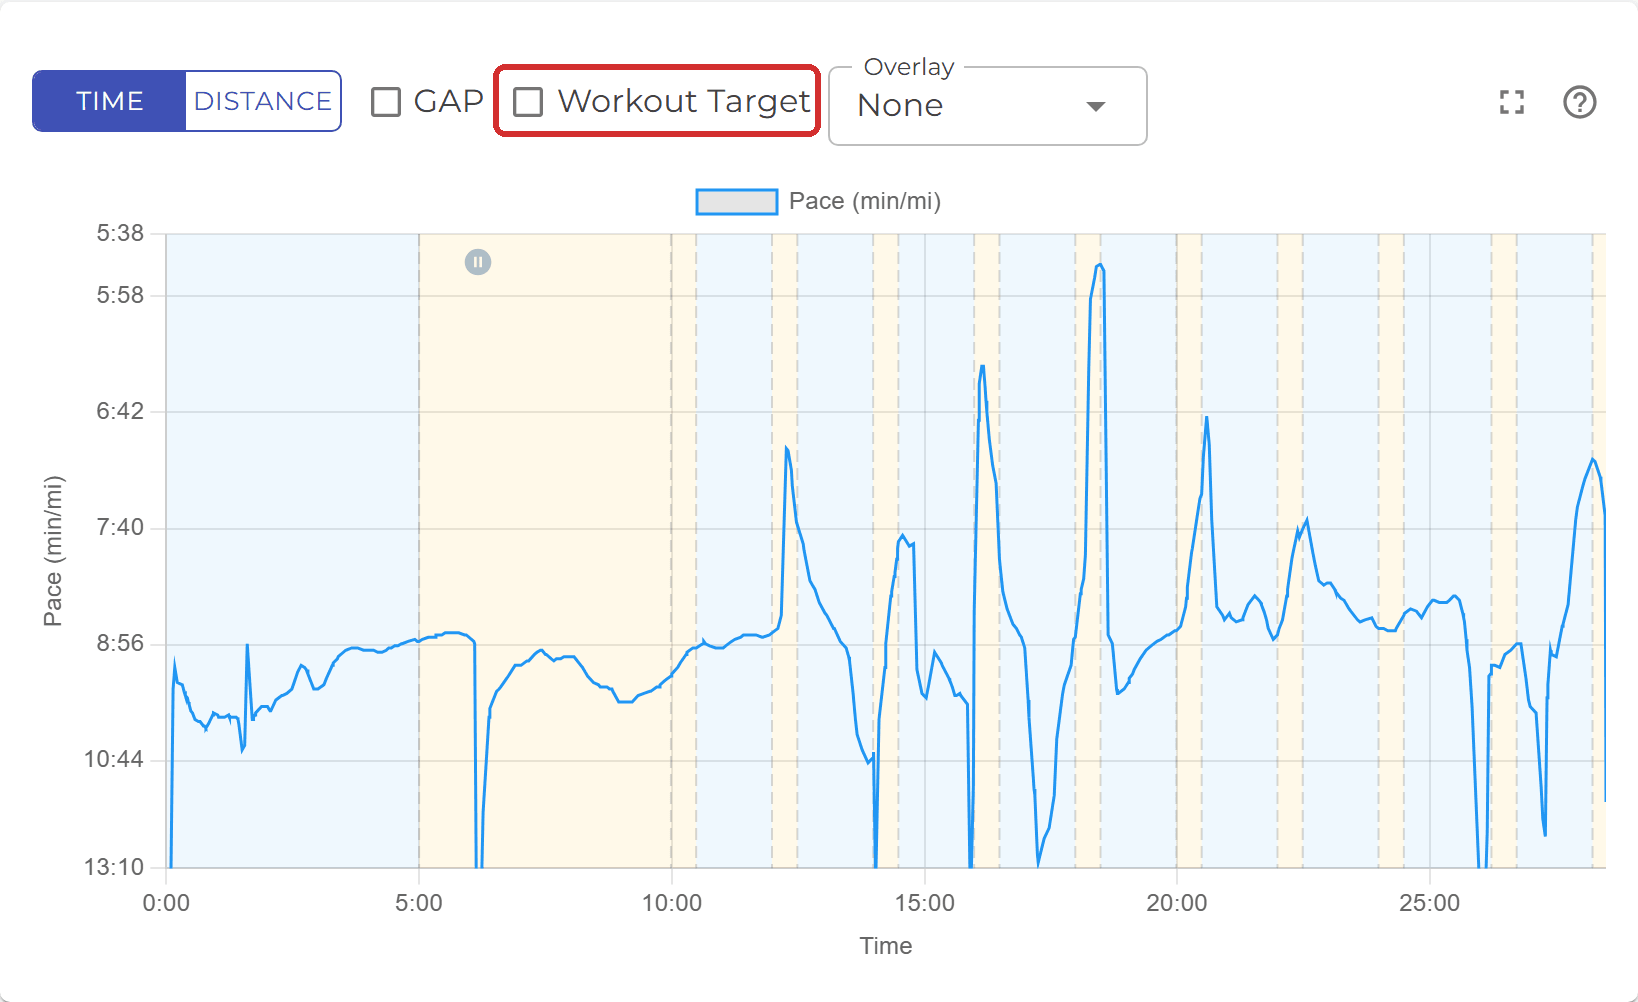
Untick Workout Target (on a phone it is in the gear menu, see Where are the chart options on my phone?) to see the line on its own. The boxes and skyline go; the tint and dividers stay, so you can still tell the steps apart.
Where the targets come from
The caption under the chart says which targets the boxes show:
- Workout Target: Executed steps - the watch recorded the structured workout, so each box sits exactly where that step was run, pauses excluded. A session cut short shows only the repeats that happened.
- Workout Target: Planned - the watch did not record the steps (a free run matched to the assignment, or an older watch), so the plan is replayed as written from the start.
- Workout Target: Targets from the watch (plan changed since) - the workout was edited after it was sent to the watch, so the boxes show the targets the watch actually had.
Targets are the athlete’s own: a step written as a percentage of threshold pace or FTP becomes that athlete’s pace or watts. See Zones and benchmarks.
Move the mouse over the plot (on a phone, touch and hold a point) and one card follows the cursor:
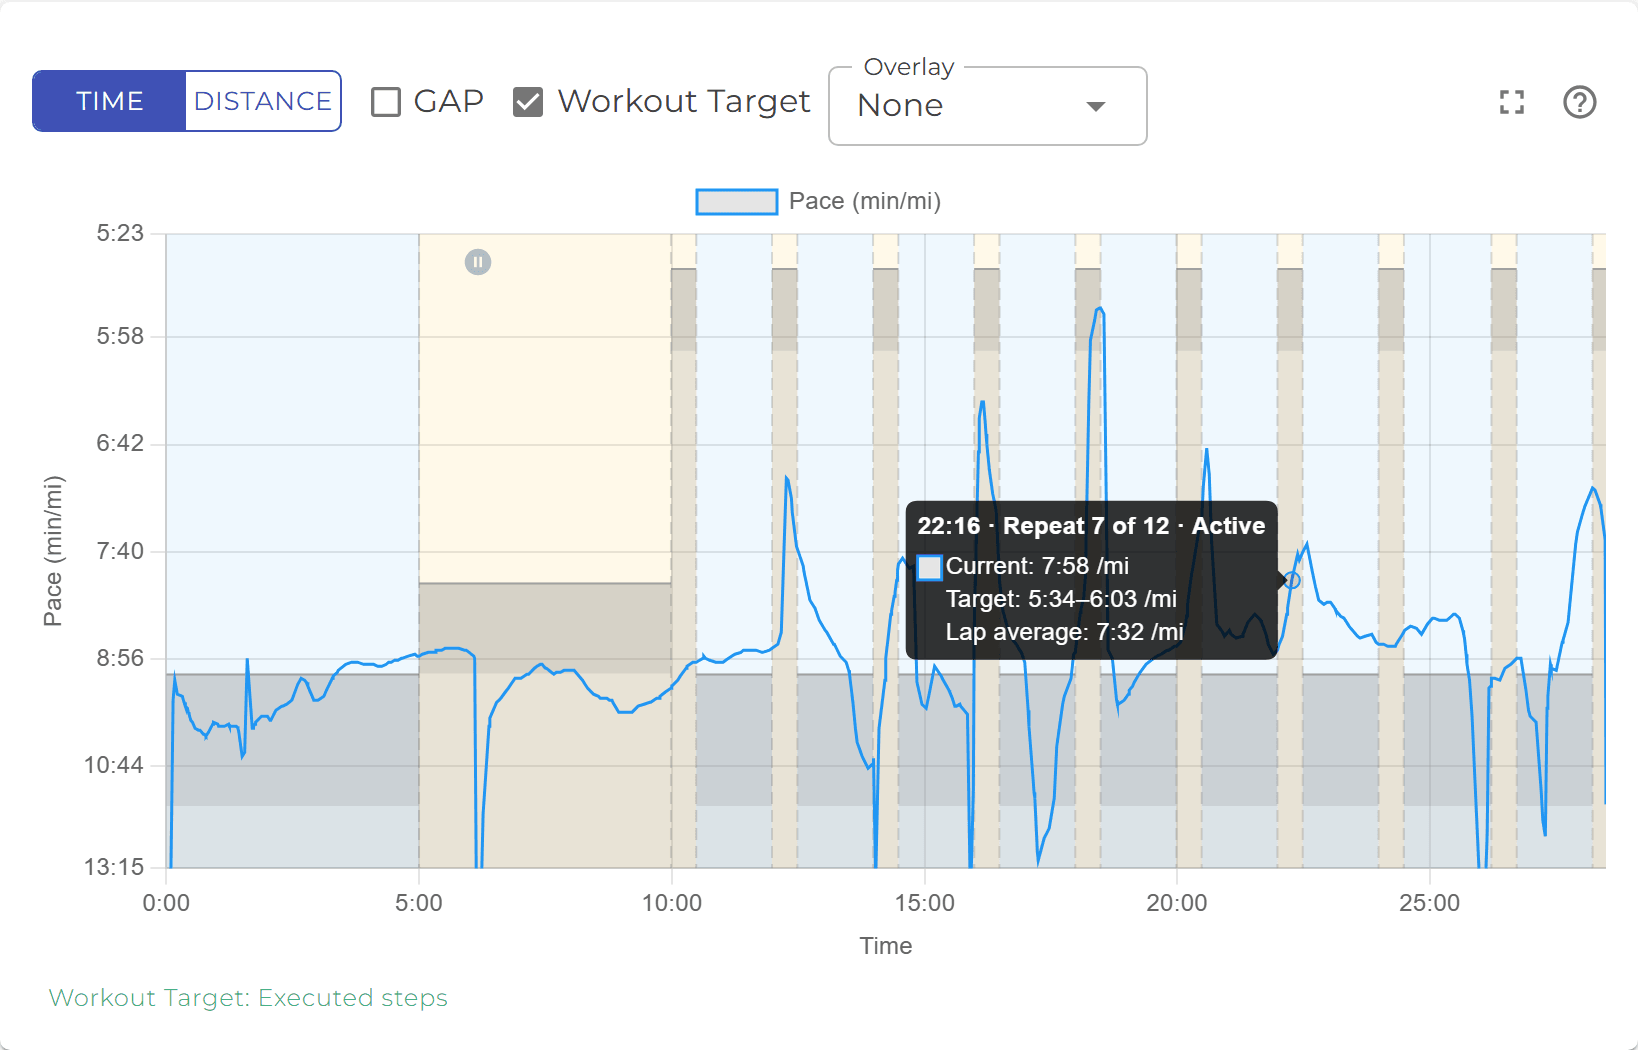
- The title is the moment (time or distance, matching the axis) and the step it falls in, for example 22:16 · Repeat 7 of 12 · Active.
- Current is the value at that moment.
- Target is the step’s target range. It appears only inside a step with a target, and only while Workout Target is on.
- Lap average is how the athlete actually ran that whole step, so you can compare it with the target without reading the line.
- An overlay series, if you added one, follows as its own row.
A grey pause icon (two bars in a circle) near the top of the plot marks where the watch stopped - the athlete pressed pause, or auto-pause kicked in at a road crossing.
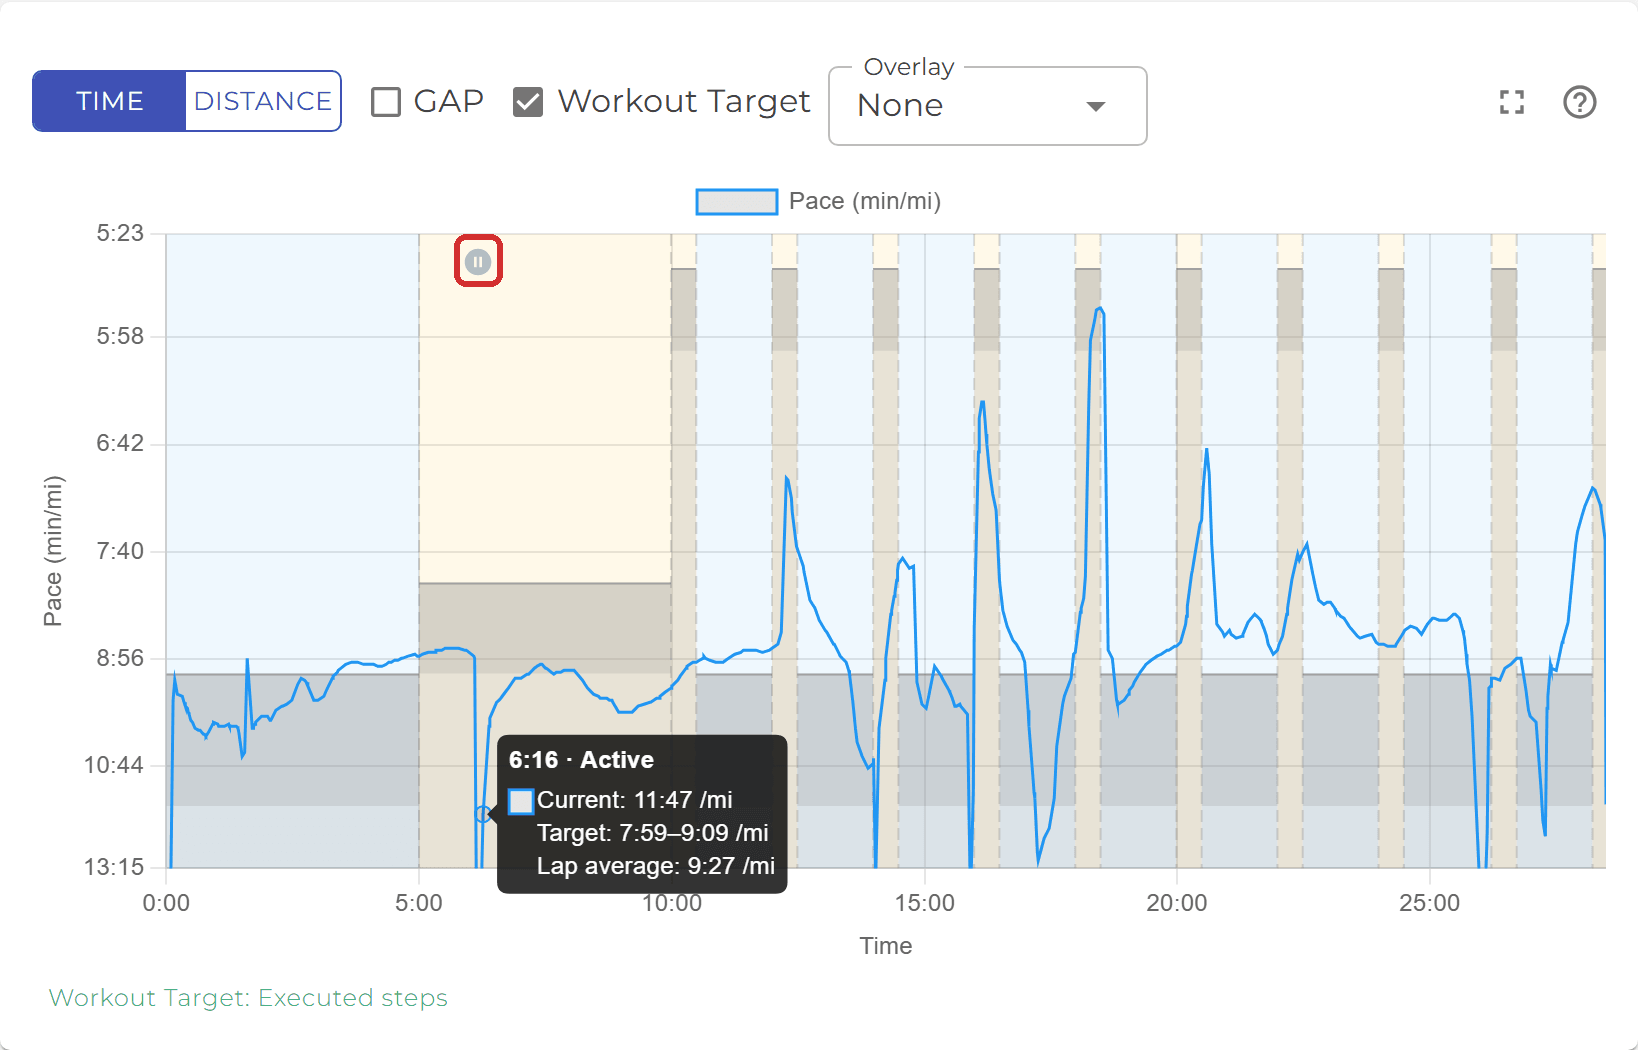
The time axis counts moving time, so a pause does not stretch the chart; the line simply continues from where the watch resumed. The card on the sample where the stop sits adds a Paused line with the length of the stop, for example Paused 0:22. On the Distance axis the icon is not drawn - nothing was covered while stopped.
Both live in the control row above the chart (in the gear menu on a phone).
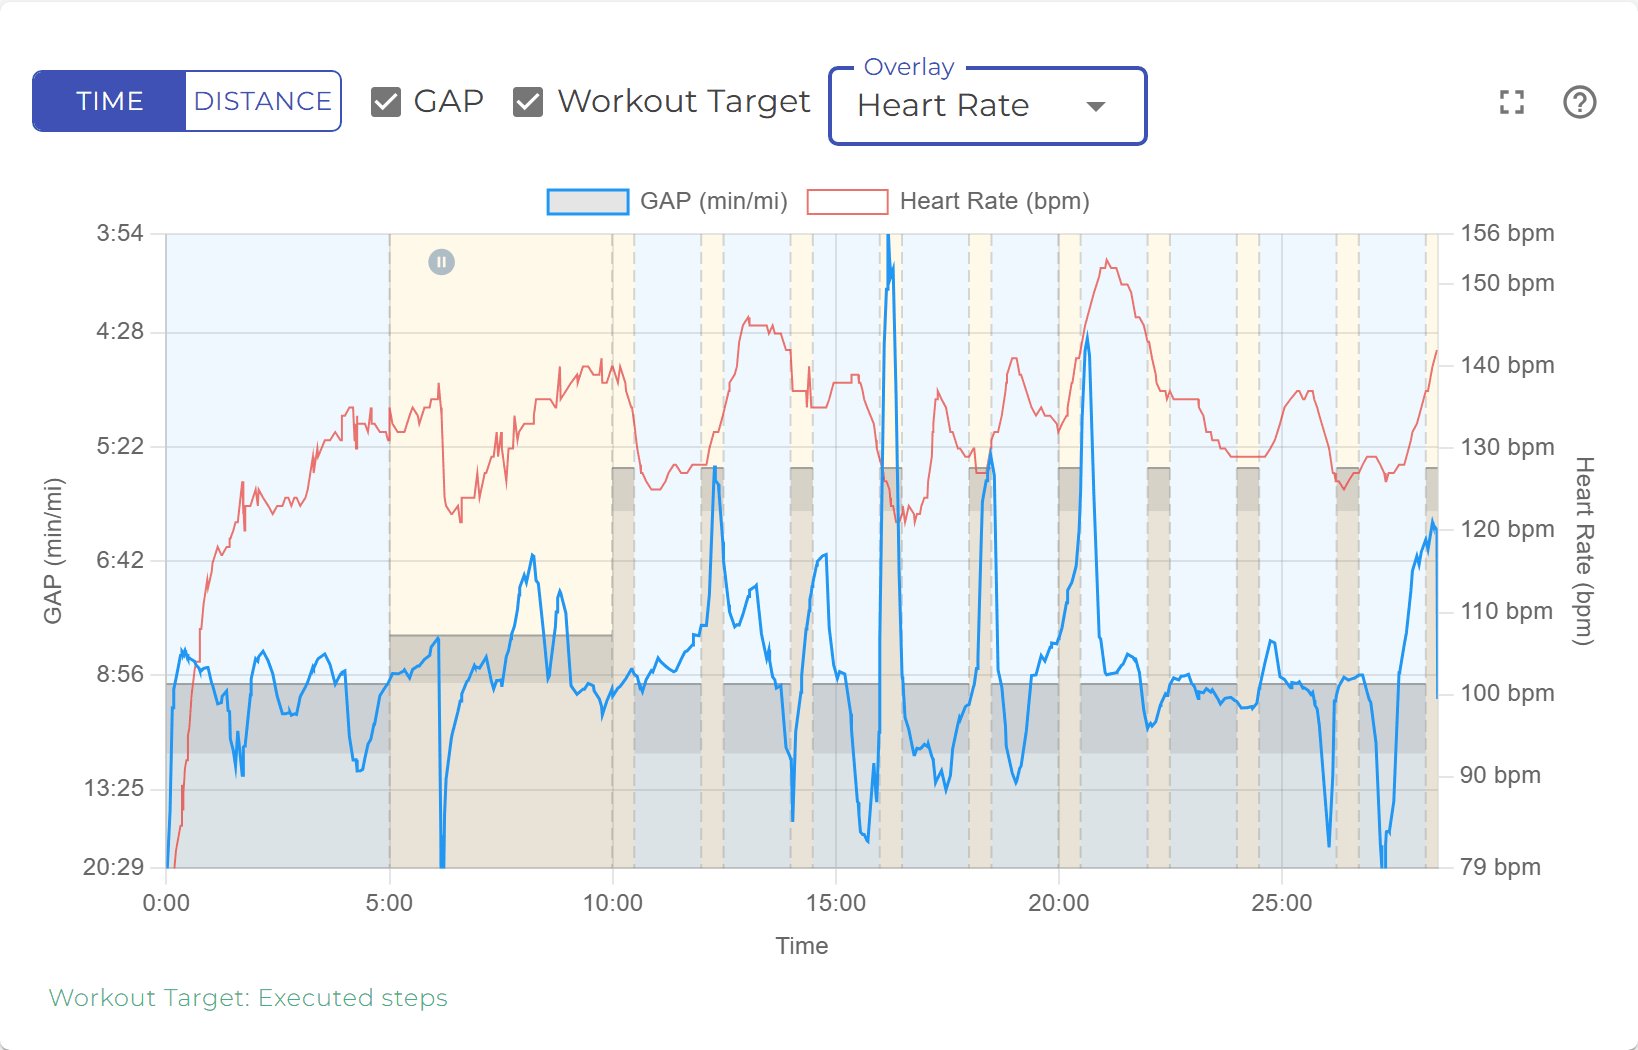
- GAP (grade-adjusted pace) is offered for runs with elevation data. Ticking it swaps the pace line for the pace the same effort would have produced on flat ground, so a hill repeat run uphill at 7:40 can read as a 6:30 effort. The target boxes stay where they are; compare GAP with the target on a hilly course.
- Overlay adds a second series on its own axis on the right: Heart Rate, Elevation or Cadence when the watch recorded them, and Speed on a power chart. Choose None to take it away. The overlay joins the legend and the tooltip card.
On a phone the chart runs edge to edge and the control row is one line: the Time / Distance toggle stays visible, and the rest moves behind the gear icon.
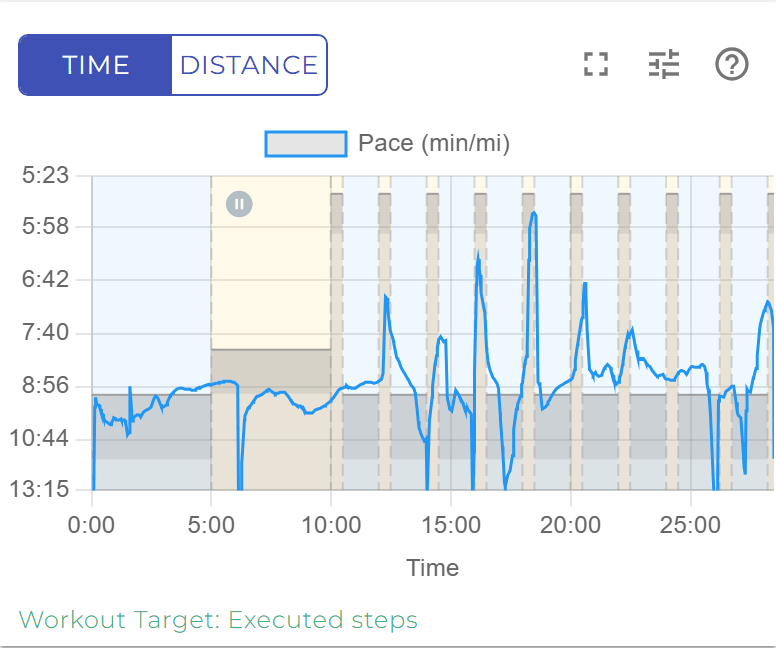
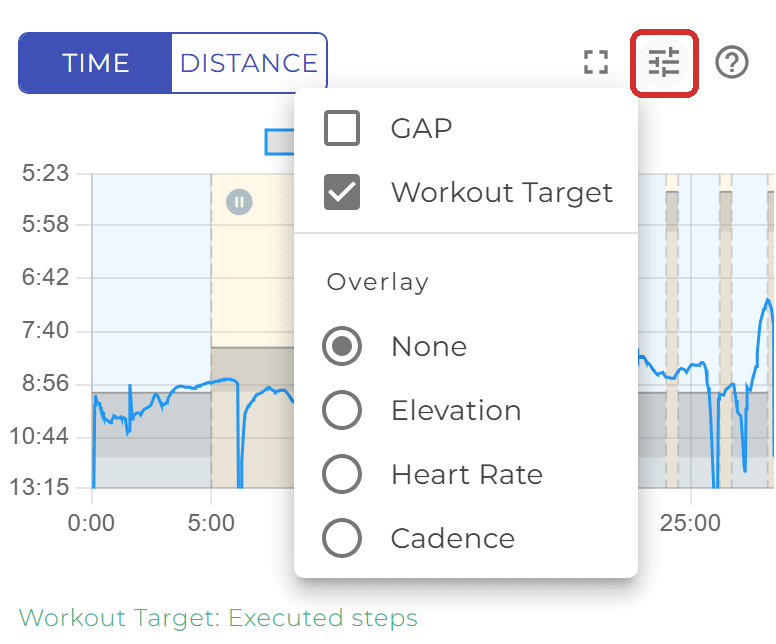
- Tap the gear for GAP, Workout Target and Overlay. The menu stays open while you flip them, so you can switch two things in one go; tap outside to close it.
- The gear is hidden when there is nothing to choose - no elevation for GAP, no targets, and no overlay series in the file.
- The rotated axis titles are not drawn on a phone; the legend above the plot names the series instead, which gives the plot the extra width.
- To see the card, touch and hold a point on the chart. For a bigger chart see How do I make the chart bigger?.
A ride recorded with a power meter or a smart trainer is charted on a power axis in watts.
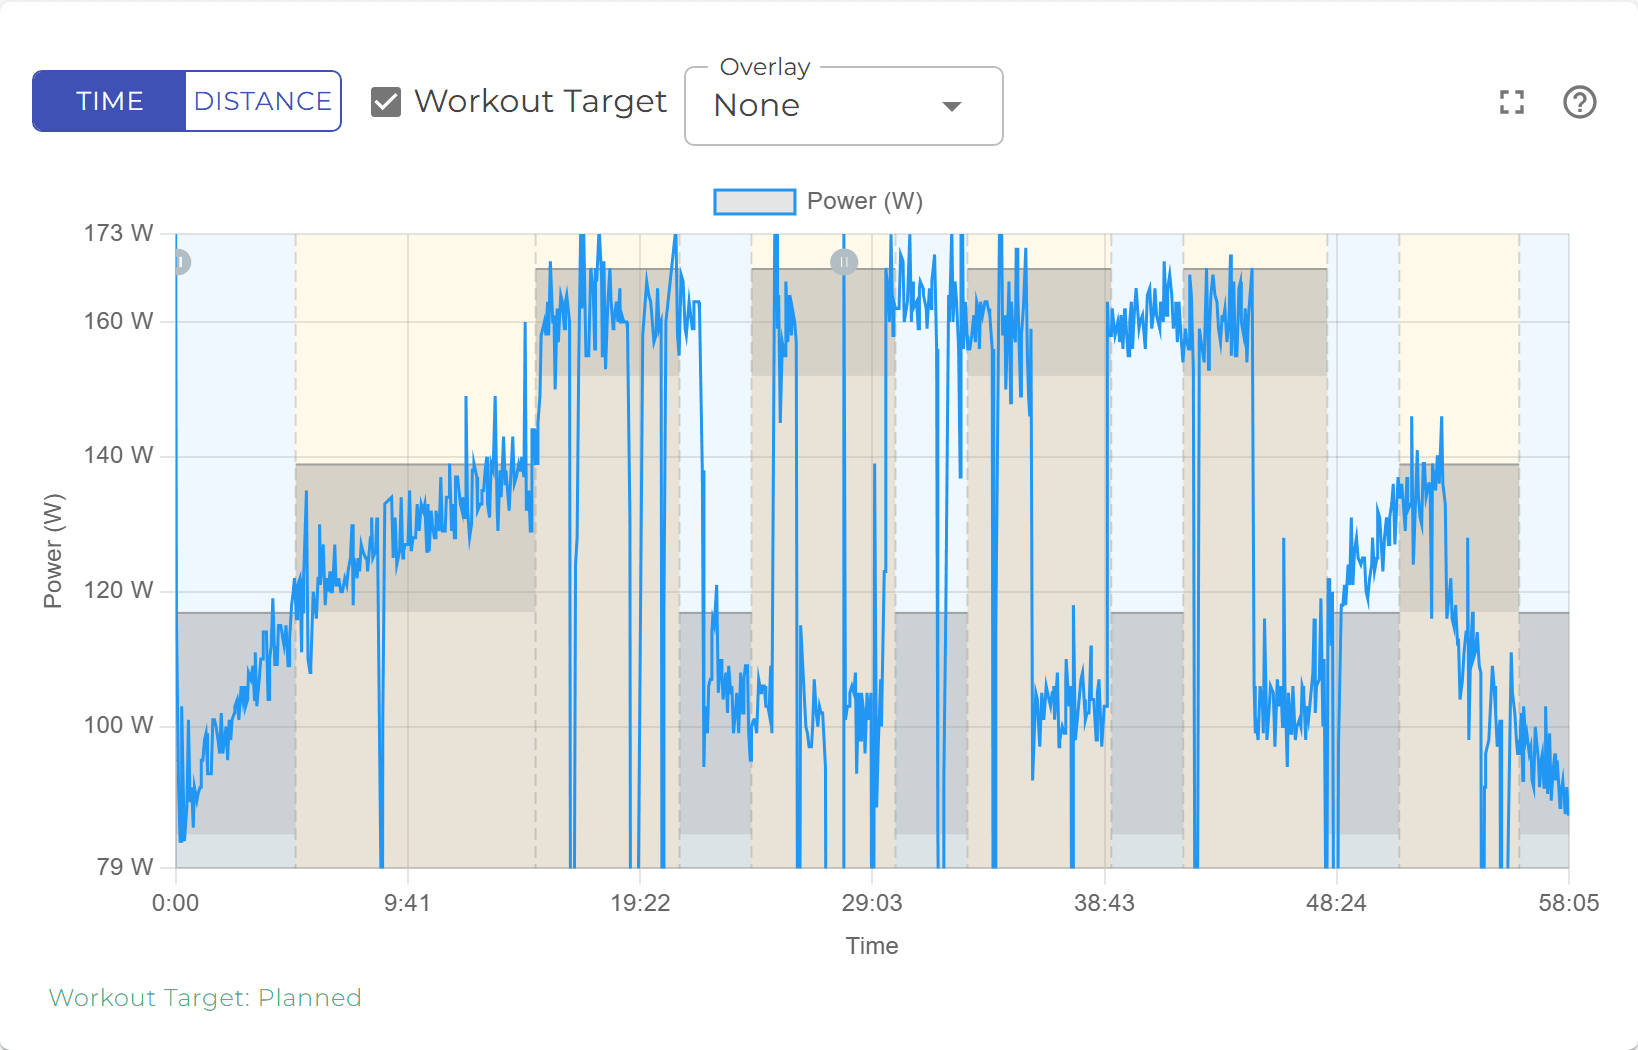
- The target boxes are watt ranges. A step written as a percentage of FTP is scaled to the athlete’s own FTP from their benchmarks, so two athletes riding the same workout see different boxes. See Zones and benchmarks.
- Speed is offered as an overlay on a power chart; GAP is not, since it is a running measure.
- A ride without power data falls back to a speed chart; a power-targeted workout ridden without a power meter shows no boxes, because watts cannot be drawn on a speed axis.
The expand icon (four corners) in the chart’s control row expands the chart.

Tap it and the same chart - its control row, legend, plot and caption - fills the screen above the app bar. Nothing is redrawn, so the axis you chose, GAP, Workout Target and the overlay are exactly as they were, and the card still follows your finger.
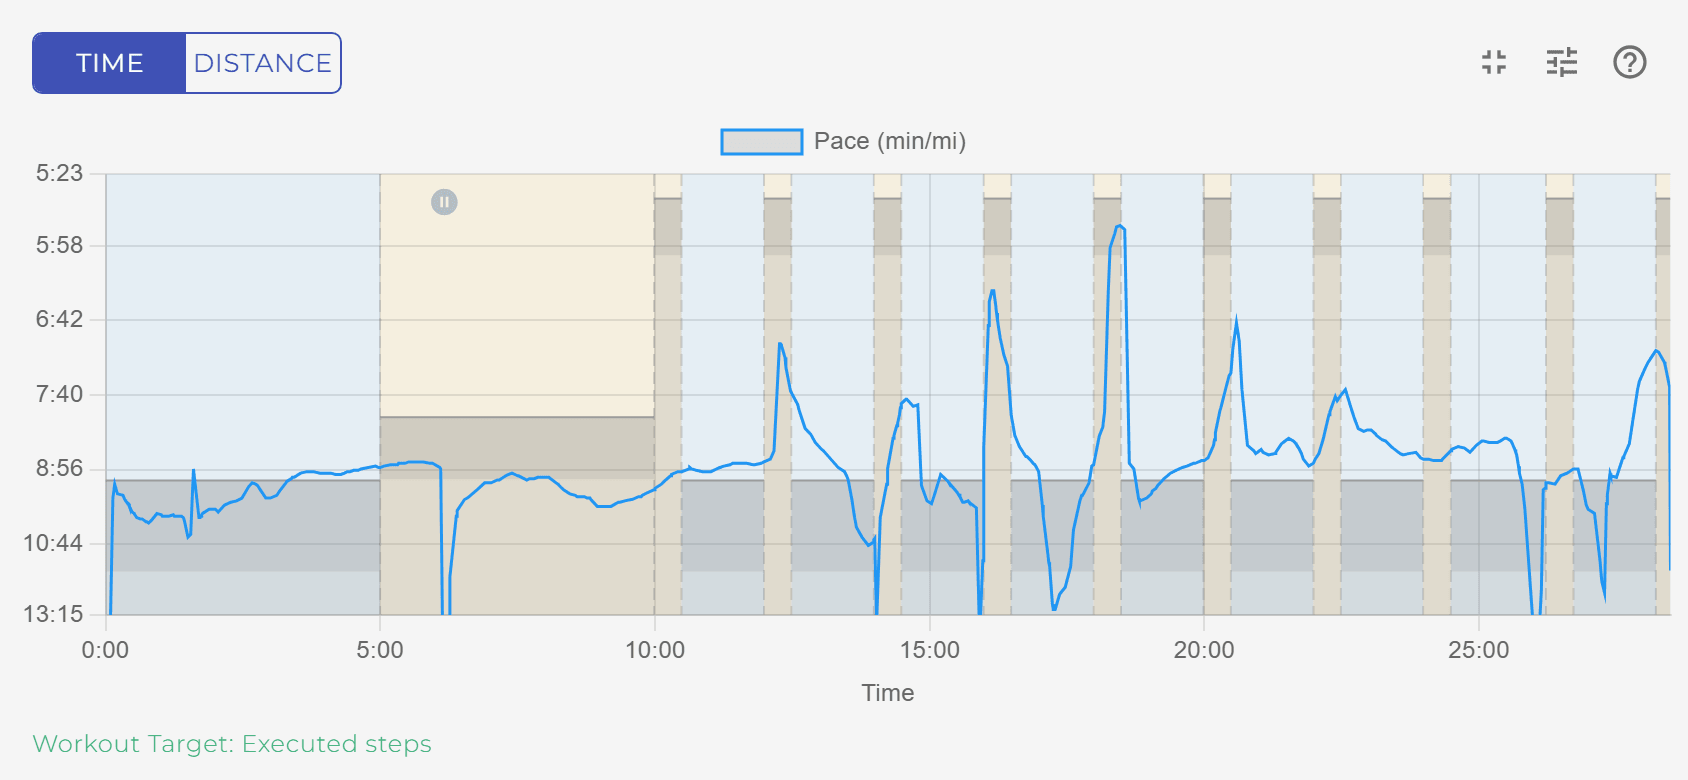
On a phone, rotate to landscape for the widest plot; in portrait a hint reminds you. Where the browser allows it the chart also goes full screen. To come back, tap the collapse icon in the same place or press Escape on a keyboard.